
Reports & Analytics
Get real, data-driven visibility into your site operations. OnSite aggregates all module data and provides visualized, exportable reports for executive decisions. Create custom reports in minutes.

Detailed description
The OnSite Reports & Analytics module aggregates, organizes and visualizes data from all platform modules on a single dashboard. From HR data through access control and safety to truck gate traffic and visitor management — all data available in one place, in real-time. The module offers not just predefined reports: you can create custom reports from available data with a drag-and-drop report builder. Reports can be automatically generated and scheduled: managers receive last week's summary every Monday morning, and safety officers get automatic alerts when any metric drops below critical level.
See it in action
What problems does it solve?
Data scattered: in HR, Excel, email, paper — impossible to get a unified picture
Report creation takes hours: manual data collection, copying, formatting
Managers don't get information in time: decisions based on outdated data
No alerts for critical metrics: problems discovered too late
Compiling authority reports is panic-driven: days of data gathering
Key features
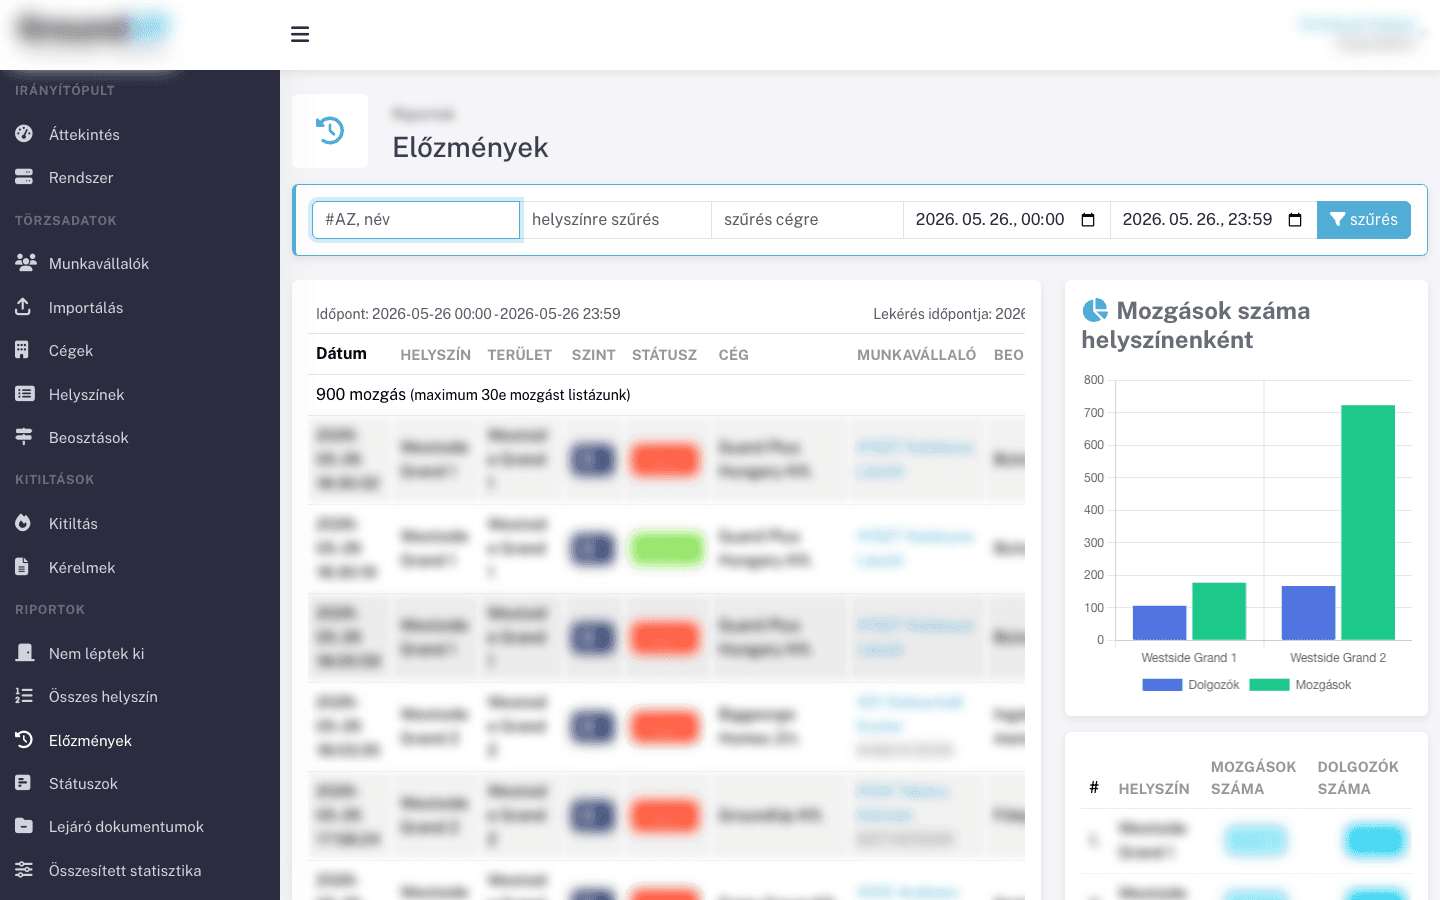
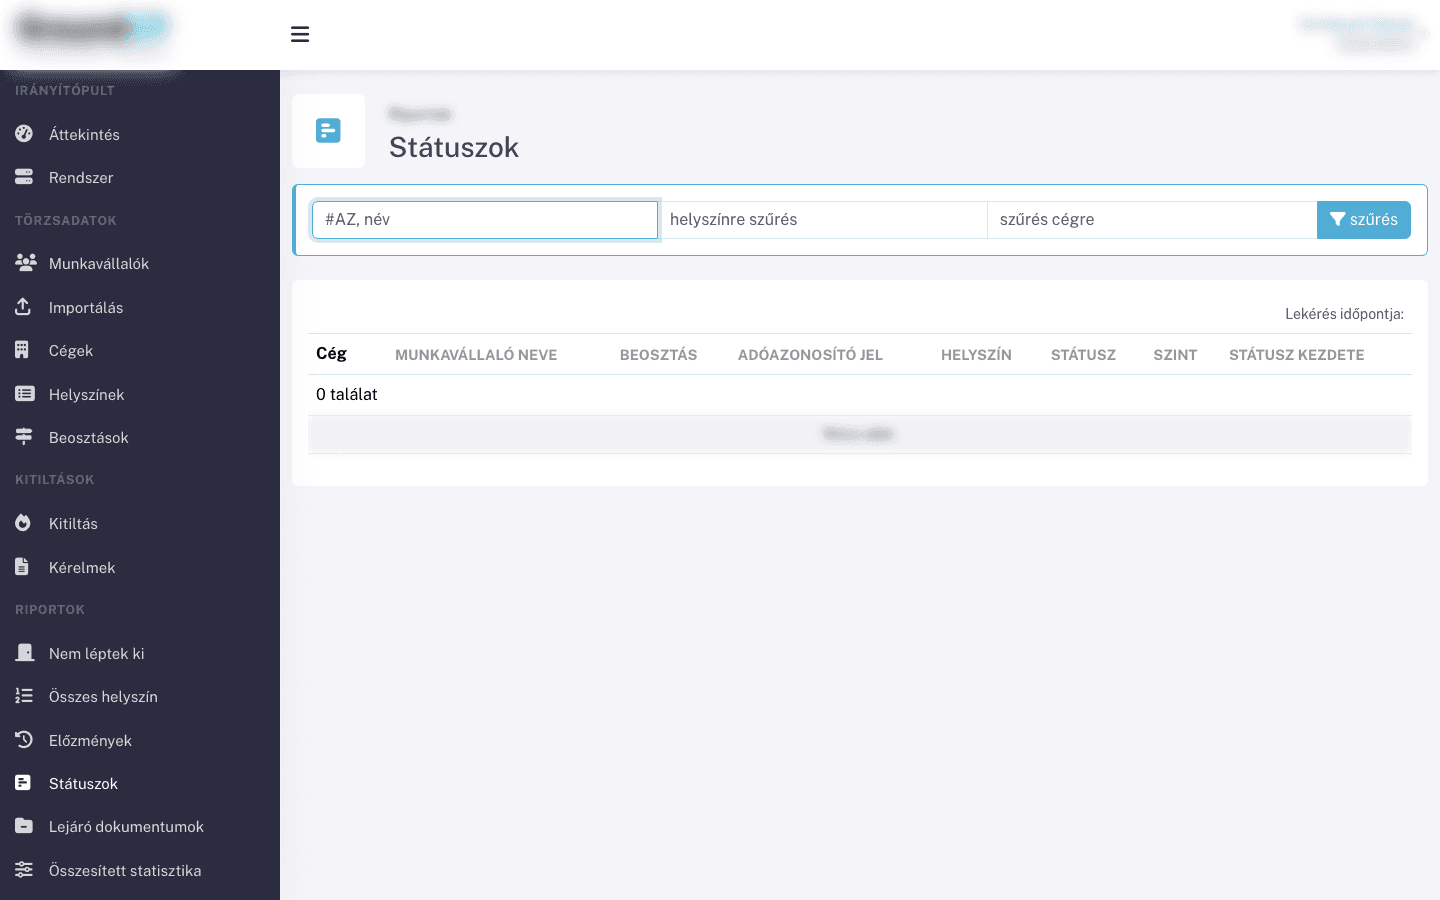
Unified Dashboard
All module data on a single, customizable dashboard. Real-time updates, interactive charts and graphs.
Custom Report Builder
Drag-and-drop report editor: choose data sources, filters and visualization types. Save report templates for reuse.
Automatic Scheduled Reports
Reports automatically generated and emailed: daily, weekly, monthly schedules. Managers receive key data without logging in.
KPI Monitoring & Alerts
Define thresholds (KPIs) and get automatic alerts when any metric drops below or rises above critical levels.
Export & Sharing
Export reports in PDF, Excel and CSV formats. Share via link or email with role-based access.
External System Integration
Report not just OnSite module data: pull in external system data (ERP, accounting, production) via API.
Benefits in numbers
90% faster report creation
Real-time data for decision-making
Automatic KPI monitoring and alerts
Custom reports with drag-and-drop editor
All data on a single dashboard
Industry use cases
Ready to digitize your site operations?
Start your free trial today and experience the difference. 14 days, all features, no strings attached.